For more information about histology solvent recycling, please contact us.. Application notes,, user lists and a bibliography are available upon request.
Fractional Distillation and Vapor Liquid Equilibrium
To understand the nature of fractional distillation and azeotropes we need to look at vapor/liquid diagrams for pairs of solvents. The graph below shows such a diagram for 2 solvents, A and B. A is the lower boiling material. The bottom of the graph shows the liquid state and the top of the graph shows the vapor state. The area in between the two curves shows what is happening in the distillation column. If we start with a mixture of A and B that corresponds to the dashed white line on the graph and the letter C1 (concentration 1). The mixture is vaporized (distilled). Follow the horizontal blue line until it reaches the vapor curve. This is concentration C2 in the diagram. This process has improved the concentration of A, the lower boiling component. The material is then condensed. Follow the white vertical line down to the liquid curve.
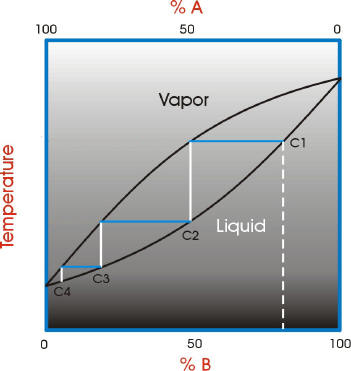
If this was simple distillation, we could stop now. However, in fractional distillation the distillation process continues. The condensed material is vaporized again. Follow the blue horizontal line across from the liquid curve at C2 to the vapor curve. There is another improvement in the concentration of the lower boiling component A. The vapor is condensed again. Follow the white vertical line down to the liquid curve.
This number of times that the process of vaporization and condensation occurs depends on the efficiency of the distillation column. The more efficient the distillation column, the more times this happens and the purer the final product will be.
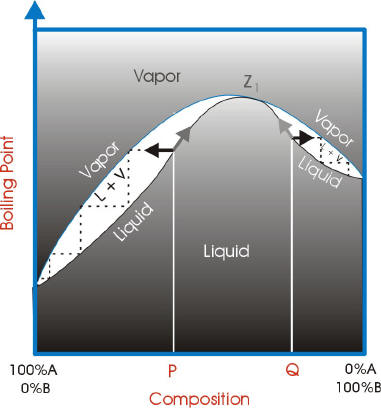
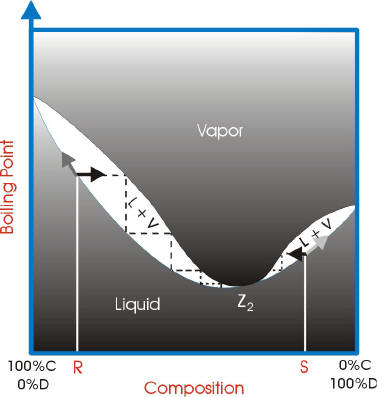
With azeotropes, the vapor liquid curves are not ideal and have a point where the vapor curve meets the liquid curve. This point is called the azeotrope point.
If the azeotrope point has a lower boiling point than the components, it is a minimum boiling azeotrope.
If the azeotrope point has a higher boiling point than the components, it is a maximum boiling azeotrope.